
Digital Platform
SensWare - A comprehensive insight into air quality and noise levels
To display the data on air quality and noise levels, we have developed our own digital platform SensWare, which provides reliable real-time data.
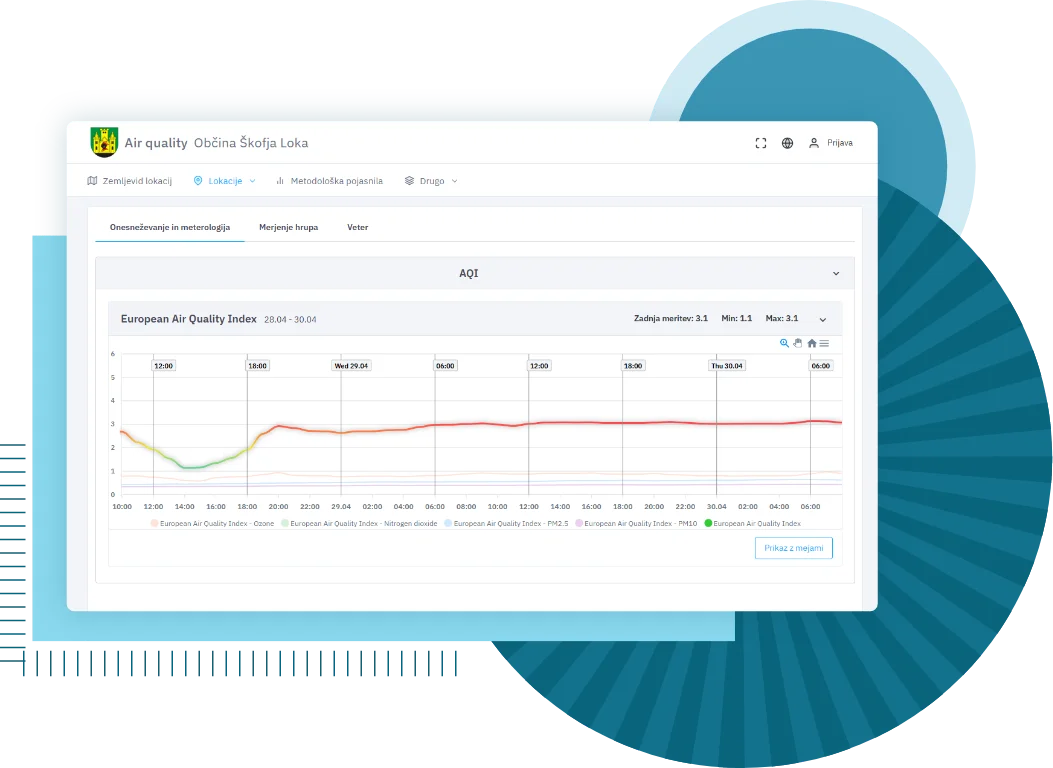

The data sent by the monitoring stations is processed and presented in clear, user-friendly formats across municipal websites, our digital platform, and the smartphone app.
We use the EAQI – European Air Quality Index, an internationally recognized air quality index, as a key indicator of pollution.
What is EAQI?
A measure of air quality in Europe
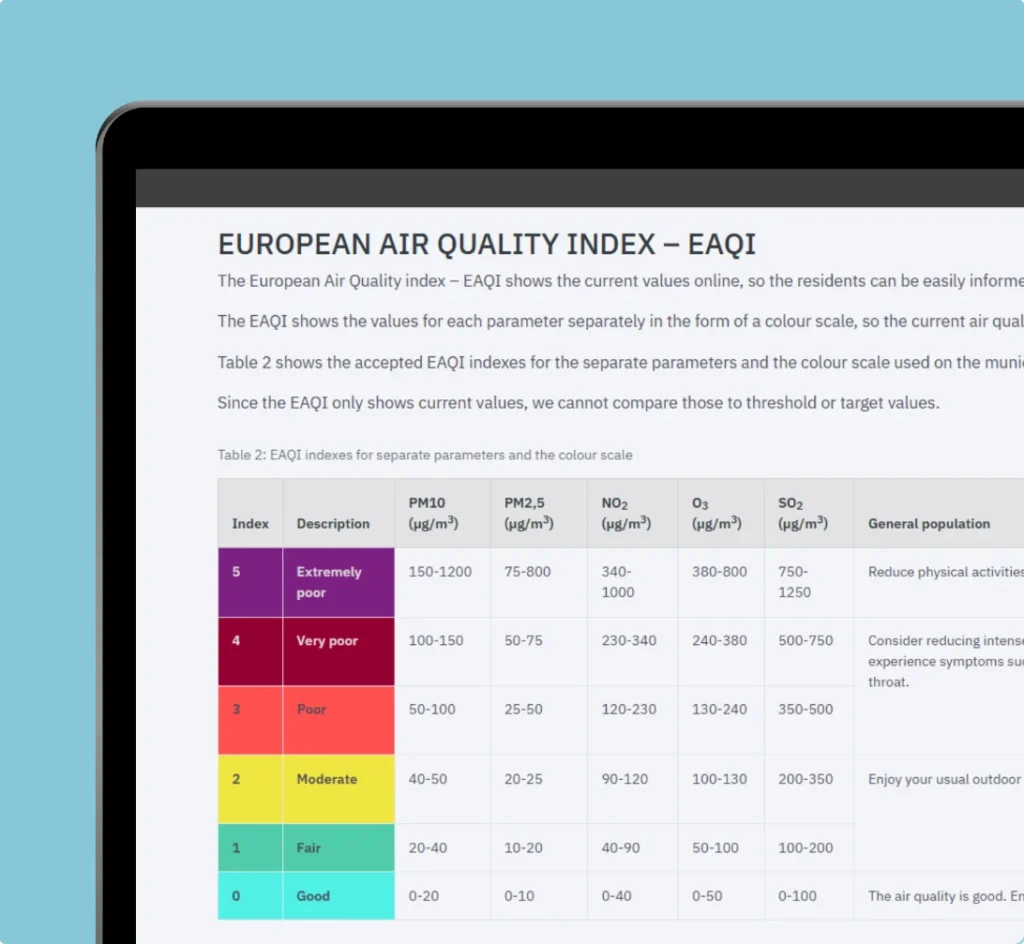
It is a standardized numerical scale that converts measurements of pollutants (PM10, PM2.5, O3, NO2, SO2, CO) into a simple indicator for the public.
• Low values indicate good air quality.
• Higher values indicate poorer air quality and may pose a health risk, initially to vulnerable groups (children, the elderly, people with chronic conditions) and eventually to the general population.
In Slovenia, we use the EEA (European Enviromental Agency) scale with six levels of pollution.
Interactive map with the locations of monitoring stations
The digital platform’s interactive map clearly shows the locations of all active monitoring devices that track air quality and noise levels in real time. Each location is marked by a dot, the color of which reflects the current pollution level based on the European Air Quality Index (EAQI). This allows users to quickly assess at a glance where conditions are good, moderate, or potentially hazardous to health.
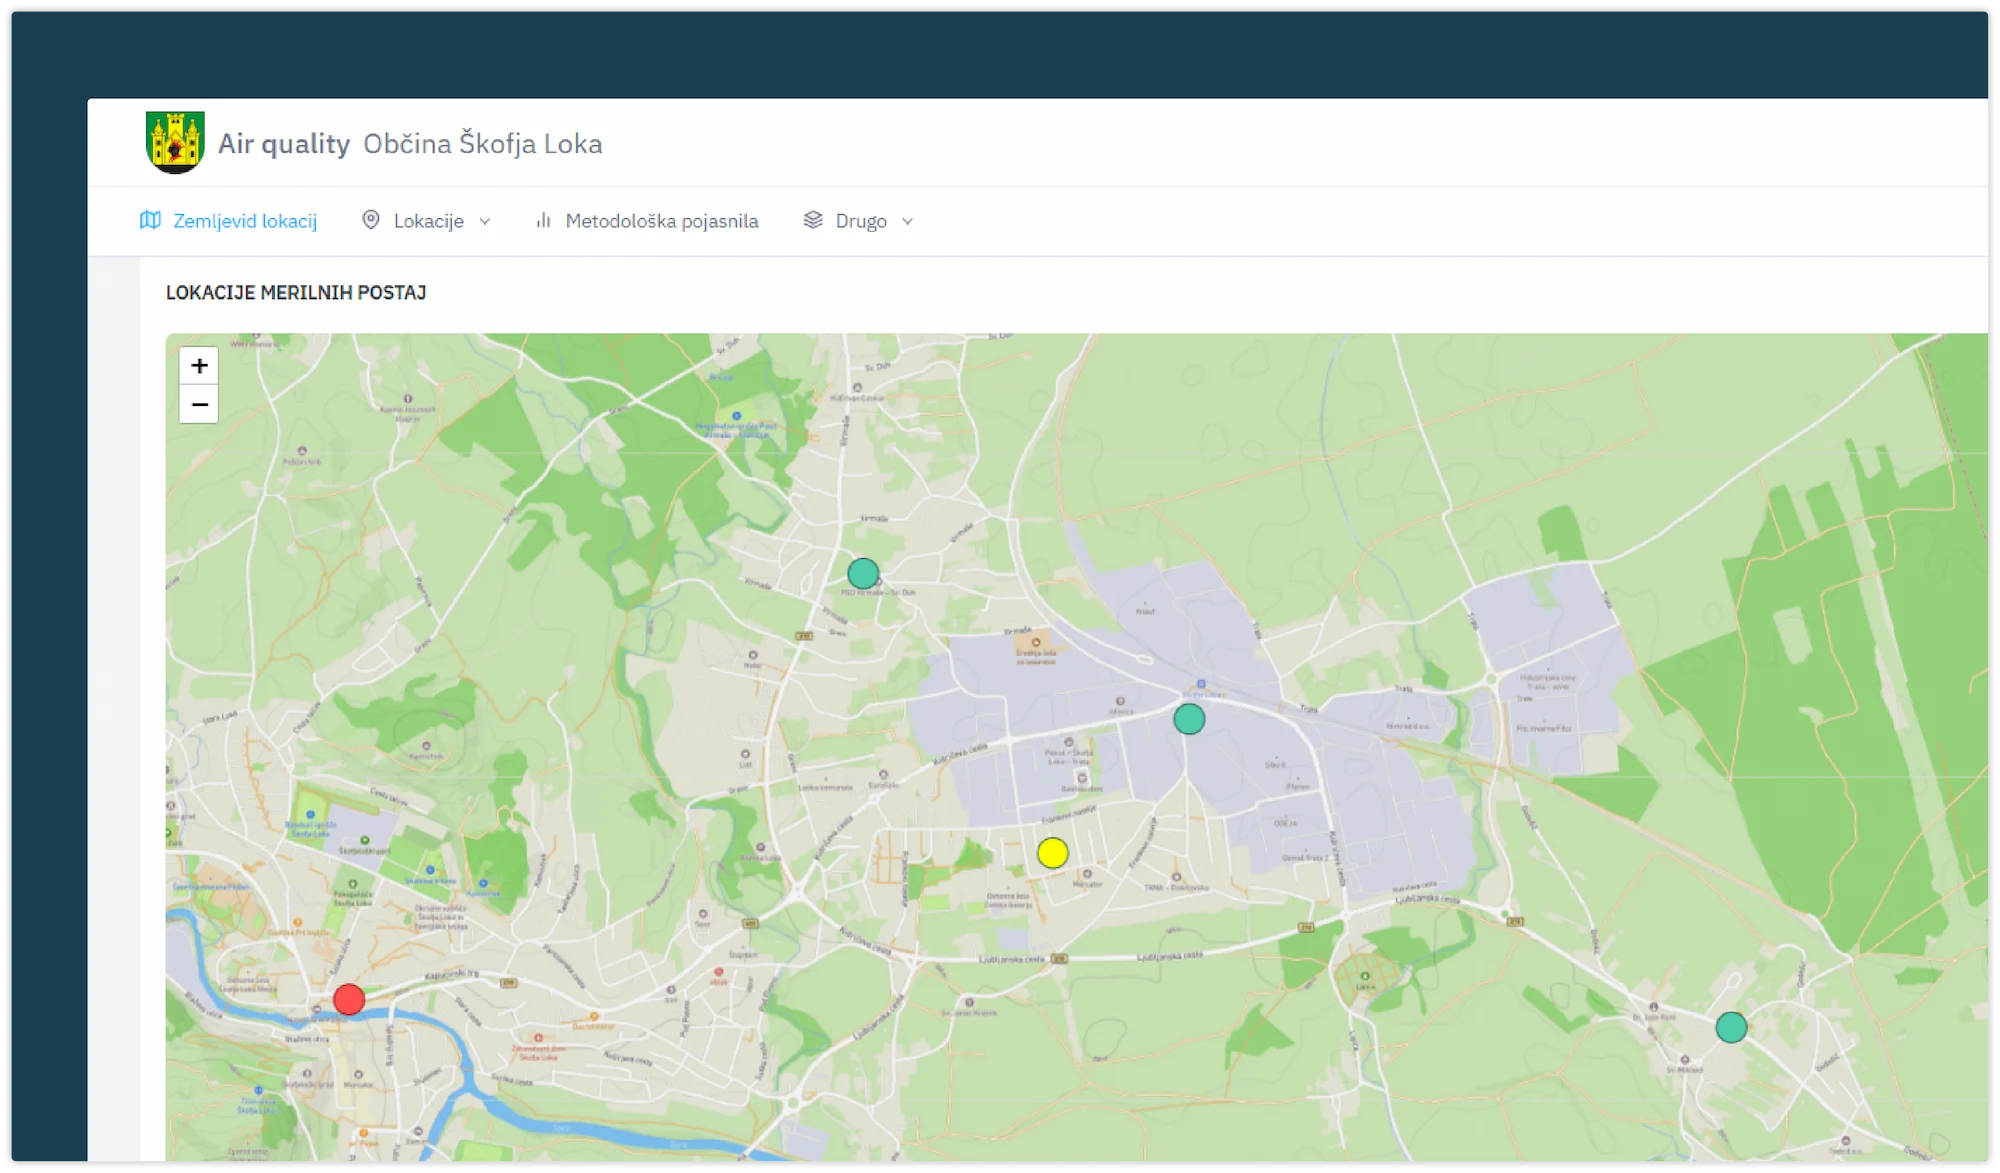
The color scale is aligned with EAQI international standards and provides easy orientation, even for less experienced users. Clicking on an individual dot expands the map to display additional information, including precise data on the measured values of individual pollutants (e.g. PM2.5, NO2, O3), trends from recent hours or days, and other useful information like weather conditions or noise levels.
Display by individual sensor
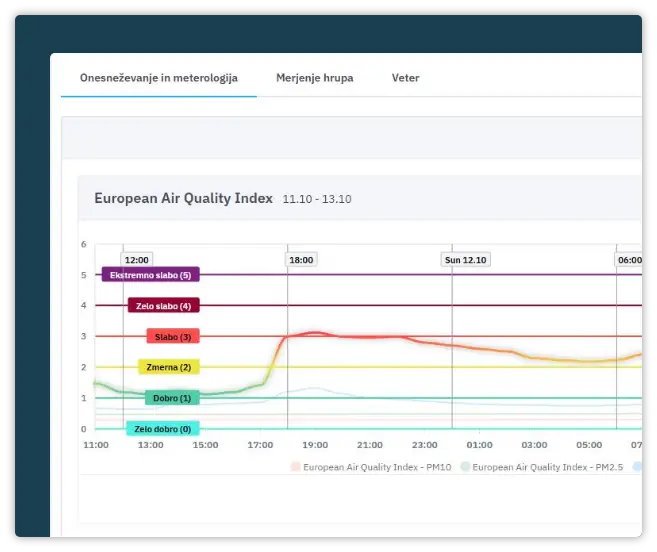
The display for each sensor on the digital platform allows users to view hourly averages of various pollutants over the past 48 hours, which provides sufficient detail to track short-term changes and identify daily pollution patterns.
The map is designed as an intuitive interface, that allows users to easily understand the collected data. It includes clear visual representations, color scales, and explanations that help clarify the meaning of individual measurements.
For more advanced users
In addition to its publicly accessible section, the SensWare digital platform also includes an advanced module with restricted access, designed for more advanced users such as specialized municipal departments, researchers, environmental inspectors, and project partners. This part of the system provides a more detailed view of the measurements, device management, and access to advanced analysis and reporting features.
A user can access the complete set of measured data for individual parameters (PM2.5, PM10, NO2, O3, noise, etc.) and view them in tabular form or export them for further processing (e.g. CSV, Excel).
Would you like to know more about indicative air quality and noise monitoring?
Please contact us and we will be happy to discuss your needs and situation, working with you to find the best possible solution for everyone involved.