Heat Islands

Heat Islands

What are Heat Islands?

In densely built-up urban areas, concrete, asphalt and building facades heat up significantly during the day and continue to release the accumulated heat long after sunset. The lack of trees, green spaces, and shade further exacerbates this effect, which is why temperatures in such areas can be significantly higher than in greener parts of the city.

Impact on People

Heat islands directly affect people. Higher temperatures reduce the comfort while living and moving around the city and increase the heat stress on residents.

Detection of Heat Islands and Possible Measures

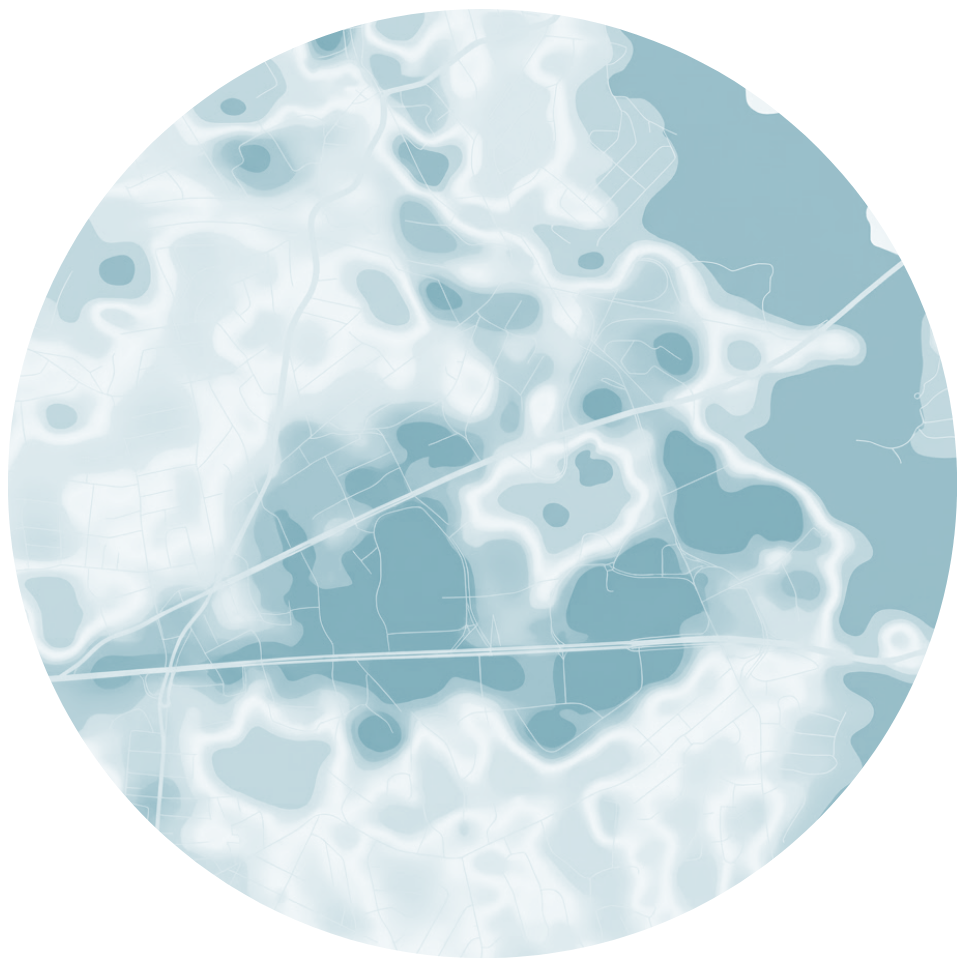
Through local measurements, we can accuratelydetermine where the city overheats the most.This data serves as an important basis for planning green spaces, shading, and other measures to reducethermal load.

Monitoring Heat Islands

Preliminary mobile measurements

We conduct measurements using an e-bike equipped with an environmental parameter monitor across a wider area of the city. This allows us to quickly gain a spatial overview of temperature differences, identify potential overheating areas and determine locations suitable for closer monitoring.

Monitoring Network

Based on preliminary measurements, we establish a monitoring network by selecting key locations and installing stationary monitors at those sites. These monitors enable long-term, continuous monitoring of temperature conditions in selected areas.

Data Analysis

Based on data from the monitors, we analyze the temperature trends throughout the day and night and under various weather conditions. By comparing the data, we identify heat islands. We then correlate the monitoring results with the characteristics of the area and analyze the causes of overheating.

Based on the intensity of overheating, the characteristics of the area, and the exposure of residents, we determine priority areas. In this way, we identify locations where measuresto reduce overheating are most needed andwhere they can have the biggest impact.

FIRST, WE EXAMINE THE WIDER AREA

Using an e-bike equipped with a monitor, we take measurements across a wider area of the city and quickly obtain a spatial overview of temperature differences.

AT INTERESTING LOCATIONS, WE MONITOR OVER A LONGER PERIOD

Based on preliminary measurements, we select key locations and install five stationary monitoring stations there to continuously monitor conditions.

WE ANALYZE

We analyze the collected data and identify areas with the greatest overheating and increased thermal load.

Client-Friendly Data for the Further Action

Alfa Proxima conducts monitoring, tracks temperature conditions, and provides a reliable and objective data set.

Based on the data collected, municipalities, urban planners, architects, constructors and other competent institutions can determine the most appropriate solutions and ensure their planning and implementation.

After the measures have been implemented, we continue to monitor temperature conditions using the monitoring network and provide data for an objective evaluation of their actual impact. This allows us to track changes over time and verify whether the measures taken have actually reduced thermal loads and improved conditions in the space.

The monitoring network is therefore not intended solely for one-time measurements, but rather enables long-term monitoring and reliable evaluation of the effectiveness of the measures implemented.

THERMAL LOAD MAPS

The maps show temperature differences in the area under consideration and clearly indicate which parts of the area are more susceptible to overheating and which are less so.

COMPARISON BETWEEN MONITORING LOCATIONS

We compare temperature conditions at individual monitoring locations and determine how significant the differences are between different parts of the city.

NIGHT AND DAY MONITORING

Using time profiles, we monitor how individual locations heat up during the day and how quickly they cool down at night. In this way, we identify areas where the thermal load persists for a longer period of time.

IDENTIFYING THE HOTTEST AREAS

Based on the measurements, we identify areas with more significant overheating (hot spots) where the thermal load is highest.

IDENTIFYING PRIORITY AREAS

We classify areas based on the intensity of overheating, spatial characteristics, and residents’ exposure, thereby identifying where measures are most needed.

ANALYSIS OF THE CAUSES OF OVERHEATING

We correlate the measurement results with spatial features such as building density, paved surfaces, vegetation, and shading, and analyze the factors associated with overheating.

DATA SET FOR FURTHER ACTION

We compile the results into a transparent database that helps municipalities, urban planners, architects and other experts plan measures to reduce heat stress.